
Page 63 - Electrical Equipment Handbook _ Troubleshooting and Maintenance
P. 63
TRANSFORMERS
3.20 CHAPTER THREE
V P
a
V S j X I
eq S
I S R eq I S
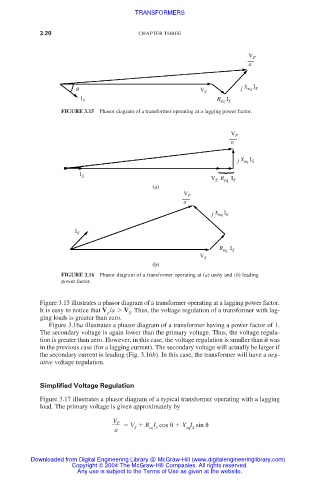
FIGURE 3.15 Phasor diagram of a transformer operating at a lagging power factor.
V P
a
j X I
eq S
I S
V S R eq I S
(a)
V P
a
j X I
eq S
I S
R eq I S
V S
(b)
FIGURE 3.16 Phasor diagram of a transformer operating at (a) unity and (b) leading
power factor.
Figure 3.15 illustrates a phasor diagram of a transformer operating at a lagging power factor.
It is easy to notice that V /a V . Thus, the voltage regulation of a transformer with lag-
S
p
ging loads is greater than zero.
Figure 3.16a illustrates a phasor diagram of a transformer having a power factor of 1.
The secondary voltage is again lower than the primary voltage. Thus, the voltage regula-
tion is greater than zero. However, in this case, the voltage regulation is smaller than it was
in the previous case (for a lagging current). The secondary voltage will actually be larger if
the secondary current is leading (Fig. 3.16b). In this case, the transformer will have a neg-
ative voltage regulation.
Simplified Voltage Regulation
Figure 3.17 illustrates a phasor diagram of a typical transformer operating with a lagging
load. The primary voltage is given approximately by
V P
V R I cos X I sin
eq S
S
eq S
a
Downloaded from Digital Engineering Library @ McGraw-Hill (www.digitalengineeringlibrary.com)
Copyright © 2004 The McGraw-Hill Companies. All rights reserved.
Any use is subject to the Terms of Use as given at the website.