
Page 121 - Academic Press Encyclopedia of Physical Science and Technology 3rd Chemical Engineering
P. 121
P1: ZBU 2nd Revised Pages
Encyclopedia of Physical Science and Technology EN002G-87 May 19, 2001 20:3
Catalyst Characterization 519
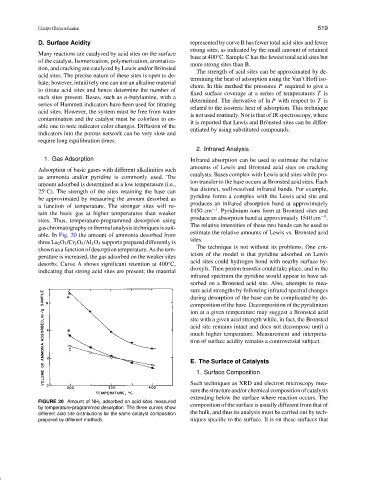
D. Surface Acidity represented by curve B has fewer total acid sites and fewer
strong sites, as indicated by the small amount of retained
Many reactions are catalyzed by acid sites on the surface
base at 400 C. Sample C has the fewest total acid sites but
◦
of the catalyst. Isomerization, polymerization, aromatiza-
more strong sites than B.
tion, and cracking are catalyzed by Lewis and/or Br¨onsted
The strength of acid sites can be approximated by de-
acid sites. The precise nature of these sites is open to de-
termining the heat of adsorption using the Van’t Hoff iso-
bate; however, intuitively one can use an alkaline material
chore. In this method the pressures P required to give a
to titrate acid sites and hence determine the number of
fixed surface coverage at a series of temperatures T is
such sites present. Beses, such as n-butylamine, with a
determined. The derivative of ln P with respect to T is
series of Hammett indicators have been used for titrating
related to the isosteric heat of adsorption. This technique
acid sites. However, the system must be free from water
is not used routinely. Nor is that of IR spectroscopy, where
contamination and the catalyst must be colorless to en-
it is reported that Lewis and Br¨onsted sites can be differ-
able one to note indicator color changes. Diffusion of the
entiated by using substituted compounds.
indicators into the porous network can be very slow and
require long equilibration times.
2. Infrared Analysis
1. Gas Adsorption Infrared absorption can be used to estimate the relative
amounts of Lewis and Bronsted acid sites on cracking
Adsorption of basic gases with different alkalinities such
catalysts. Bases complex with Lewis acid sites while pro-
as ammonia and/or pyridine is commonly used. The
ton transfer to the base occurs at Bronsted acid sites. Each
amount adsorbed is determined at a low temperature (i.e.,
has distinct, well-resolved infrared bands. For example,
◦
25 C). The strength of the sites retaining the base can
pyridine forms a complex with the Lewis acid site and
be approximated by measuring the amount desorbed as
produces an infrared absorption band at approximately
a function of temperature. The stronger sites will re- −1
1450 cm . Pyridinium ions form at Bronsted sites and
tain the basic gas at higher temperatures than weaker −1
produce an absorption band at approximately 1540 cm .
sites. Thus, temperature-programmed desorption using
The relative intensities of these two bands can be used to
gas chromatography or thermal analysis techniques is suit-
estimate the relative amounts of Lewis vs. Bronsted acid
able. In Fig. 20 the amount of ammonia desorbed from
sites.
three La 2 O 3 /Cr 2 O 3 /Al 2 O 3 supports prepared differently is
The technique is not without its problems. One crit-
shown as a function of desorption temperature. As the tem-
icism of the model is that pyridine adsorbed on Lewis
perature is increased, the gas adsorbed on the weaker sites
acid sites could hydrogen bond with nearby surface hy-
◦
desorbs. Curve A shows significant retention at 400 C,
droxyls. Then proton transfer could take place, and in the
indicating that strong acid sites are present; the material
infrared spectrum the pyridine would appear to have ad-
sorbed on a Bronsted acid site. Also, attempts to mea-
sure acid strengths by following infrared spectral changes
during desorption of the base can be complicated by de-
composition of the base. Decomposition of the pyridinium
ion at a given temperature may suggest a Bronsted acid
site with a given acid strength while, in fact, the Bronsted
acid site remains intact and does not decompose until a
much higher temperature. Measurement and interpreta-
tion of surface acidity remains a controversial subject.
E. The Surface of Catalysts
1. Surface Composition
Such techniques as XRD and electron microscopy mea-
surethestructureand/orchemicalcompositionofcatalysts
extending below the surface where reaction occurs. The
FIGURE 20 Amount of NH 3 adsorbed on acid sites measured
by temperature-programmed desorption. The three curves show composition of the surface is usually different from that of
different acid site distributions for the same catalyst composition the bulk, and thus its analysis must be carried out by tech-
prepared by different methods. niques specific to the surface. It is on these surfaces that