
Page 119 - Academic Press Encyclopedia of Physical Science and Technology 3rd Chemical Engineering
P. 119
P1: ZBU 2nd Revised Pages
Encyclopedia of Physical Science and Technology EN002G-87 May 19, 2001 20:3
Catalyst Characterization 517
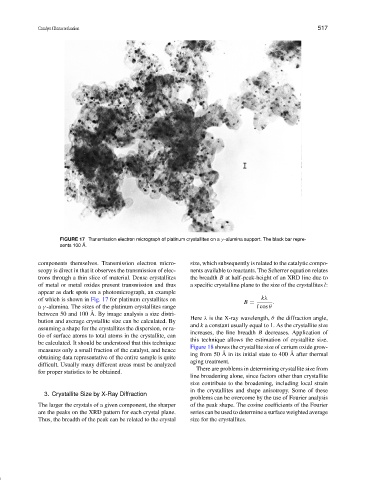
FIGURE 17 Transmission electron micrograph of platinum crystallites on a γ -alumina support. The black bar repre-
sents 100 ˚ A.
components themselves. Transmission electron micro- size, which subsequently is related to the catalytic compo-
scopy is direct in that it observes the transmission of elec- nents available to reactants. The Scherrer equation relates
trons through a thin slice of material. Dense crystallites the breadth B at half-peak-height of an XRD line due to
of metal or metal oxides prevent transmission and thus a specific crystalline plane to the size of the crystallites l:
appear as dark spots on a photomicrograph, an example
of which is shown in Fig. 17 for platinum crystallites on kλ
B = .
a γ -alumina. The sizes of the platinum crystallites range l cos θ
˚
between 50 and 100 A. By image analysis a size distri-
Here λ is the X-ray wavelength, θ the diffraction angle,
bution and average crystallite size can be calculated. By
and k a constant usually equal to 1. As the crystallite size
assuming a shape for the crystallites the dispersion, or ra-
increases, the line breadth B decreases. Application of
tio of surface atoms to total atoms in the crystallite, can
this technique allows the estimation of crystallite size.
be calculated. It should be understood that this technique
Figure 18 shows the crystallite size of cerium oxide grow-
measures only a small fraction of the catalyst, and hence
˚
˚
ing from 50 A in its initial state to 400 A after thermal
obtaining data representative of the entire sample is quite
aging treatment.
difficult. Usually many different areas must be analyzed
There are problems in determining crystallite size from
for proper statistics to be obtained.
line broadening alone, since factors other than crystallite
size contribute to the broadening, including local strain
in the crystallites and shape anisotropy. Some of these
3. Crystallite Size by X-Ray Diffraction
problems can be overcome by the use of Fourier analysis
The larger the crystals of a given component, the sharper of the peak shape. The cosine coefficients of the Fourier
are the peaks on the XRD pattern for each crystal plane. series can be used to determine a surface weighted average
Thus, the breadth of the peak can be related to the crystal size for the crystallites.