
Page 120 - Academic Press Encyclopedia of Physical Science and Technology 3rd Chemical Engineering
P. 120
P1: ZBU 2nd Revised Pages
Encyclopedia of Physical Science and Technology EN002G-87 May 19, 2001 20:3
518 Catalyst Characterization
4. Electrochemical Technique: Cyclic
Voltammetry
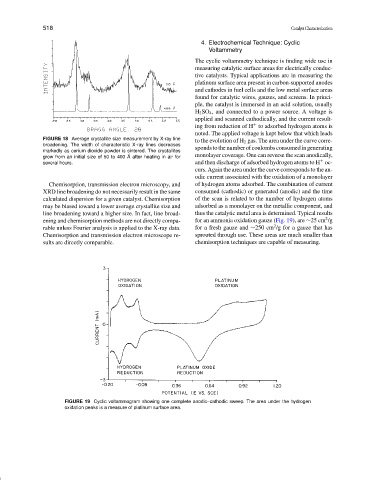
The cyclic voltammetry technique is finding wide use in
measuring catalytic surface areas for electrically conduc-
tive catalysts. Typical applications are in measuring the
platinum surface area present in carbon-supported anodes
and cathodes in fuel cells and the low metal surface areas
found for catalytic wires, gauzes, and screens. In princi-
ple, the catalyst is immersed in an acid solution, usually
H 2 SO 4 , and connected to a power source. A voltage is
applied and scanned cathodically, and the current result-
+
ing from reduction of H to adsorbed hydrogen atoms is
noted. The applied voltage is kept below that which leads
FIGURE 18 Average crystallite size measurement by X-ray line
to the evolution of H 2 gas. The area under the curve corre-
broadening. The width of characteristic X-ray lines decreases
spondstothenumberofcoulombsconsumedingenerating
markedly as cerium dioxide powder is sintered. The crystallites
monolayer coverage. One can reverse the scan anodically,
grow from an initial size of 50 to 400 ˚ A after heating in air for
+
several hours. and then discharge of adsorbed hydrogen atoms to H oc-
curs. Again the area under the curve corresponds to the an-
odic current associated with the oxidation of a monolayer
Chemisorption, transmission electron microscopy, and of hydrogen atoms adsorbed. The combination of current
XRD line broadening do not necessarily result in the same consumed (cathodic) or generated (anodic) and the time
calculated dispersion for a given catalyst. Chemisorption of the scan is related to the number of hydrogen atoms
may be biased toward a lower average crystallite size and adsorbed as a monolayer on the metallic component, and
line broadening toward a higher size. In fact, line broad- thus the catalytic metal area is determined. Typical results
2
ening and chemisorption methods are not directly compa- for an ammonia oxidation gauze (Fig. 19), are ∼25 cm /g
2
rable unless Fourier analysis is applied to the X-ray data. for a fresh gauze and ∼250 cm /g for a gauze that has
Chemisorption and transmission electron microscope re- sprouted through use. These areas are much smaller than
sults are directly comparable. chemisorption techniques are capable of measuring.
FIGURE 19 Cyclic voltammogram showing one complete anodic–cathodic sweep. The area under the hydrogen
oxidation peaks is a measure of platinum surface area.