
Page 302 - Academic Press Encyclopedia of Physical Science and Technology 3rd Chemical Engineering
P. 302
P1: FYK/LPB P2: FPP Final
Encyclopedia of Physical Science and Technology EN006C-252 June 27, 2001 14:15
102 Fluid Mixing
or reluctance with various kinds of electrical signals. It is around the mean circulation times also normally increases.
possible today to use micro-sized amplifiers that rotate The quantitative effect depends somewhat on the degree of
with the shaft and feed a signal through the slip rings with uniformity required and the blend time being considered.
very little loss in accuracy. As a general rule, the operating speed of the mixer tends
In general, a large mixing tank has a much longer cir- to go down, while the peripheral speed of the impeller
culation time and a much higher maximum macroscale tends to go up. The speed of the mixer is related to the
impeller shear rate than does a small tank. In addition, it average impeller zone macroscale shear and thus typically
has a greater variety of shear rates than does a small tank. goes down in scaleup while the impeller peripheral speed
This means that a small tank can be changed in its perfor- is often related to the maximum impeller zone macroscale
mance compared to a big tank by using a nongeometric shear rate, see Fig. 5. Out in the rest of the tank (away from
approach to the design of the mixer. There are usually two the impeller) there another spectrum of shear rates which
extremes of pilot plant objectives. One involves the use of typically is about a factor of 10 lower than the average
a more-or-less standard impeller geometry in small scale, impeller zone shear rate. These particular impeller zone
and attempts to determine the maximum efficiency of the shear rates tend to decrease on scaleup.
process on that scale. Estimates on a full-scale perfor- The microscale environment tends to have a power per
mance must be modified because the big tank is different unit volume of dissipation around the impeller about 100
in many regards, which may have beneficial or detrimental times higher than it is in the rest of the tank more or less
effects on the process. regardless of the tank size. Thus, the magnitudes of these
The other approach looks at either existing equipment in quantities can be quite similar. This brings up another
the plant or a probable design of a full-scale device. How consideration in the following paragraph.
can this be modeled in a pilot plant? This usually involves
using narrow-blade impellers and/or small-diameter im-
pellers to more closely decrease the blend time and in- C. Shear Rate Magnitude
crease the shear rate over what might usually occur when and Total Shear Work
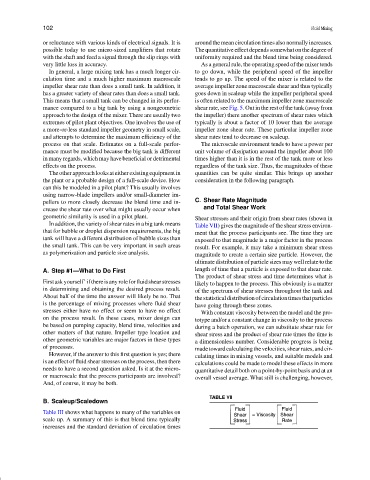
geometric similarity is used in a pilot plant. Shear stresses and their origin from shear rates (shown in
In addition, the variety of shear rates in a big tank means Table VII) gives the magnitude of the shear stress environ-
that for bubble or droplet dispersion requirements, the big ment that the process participants see. The time they are
tank will have a different distribution of bubble sizes than exposed to that magnitude is a major factor in the process
the small tank. This can be very important in such areas result. For example, it may take a minimum shear stress
as polymerization and particle size analysis. magnitude to create a certain size particle. However, the
ultimate distribution of particle sizes may well relate to the
A. Step #1—What to Do First length of time that a particle is exposed to that shear rate.
The product of shear stress and time determines what is
Firstaskyourself’ifthereisanyroleforfluidshearstresses likely to happen to the process. This obviously is a matter
in determining and obtaining the desired process result. of the spectrum of shear stresses throughout the tank and
About half of the time the answer will likely be no. That thestatisticaldistributionofcirculationtimesthatparticles
is the percentage of mixing processes where fluid shear have going through these zones.
stresses either have no effect or seem to have no effect With constant viscosity between the model and the pro-
on the process result. In these cases, mixer design can totype and/or a constant change in viscosity to the process
be based on pumping capacity, blend time, velocities and during a batch operation, we can substitute shear rate for
other matters of that nature. Impeller type location and shear stress and the product of shear rate times the time is
other geometric variables are major factors in these types a dimensionless number. Considerable progress is being
of processes. madetowardcalculatingthevelocities,shearrates,andcir-
However, if the answer to this first question is yes; there culating times in mixing vessels, and suitable models and
is an effect of fluid shear stresses on the process, then there calculations could be made to model these effects in more
needs to have a second question asked. Is it at the micro- quantitative detail both on a point-by-point basis and at an
or macroscale that the process participants are involved? overall vessel average. What still is challenging, however,
And, of course, it may be both.
TABLE VII
B. Scaleup/Scaledown
Table III shows what happens to many of the variables on
scale up. A summary of this is that blend time typically
increases and the standard deviation of circulation times