
Page 301 - Academic Press Encyclopedia of Physical Science and Technology 3rd Chemical Engineering
P. 301
P1: FYK/LPB P2: FPP Final
Encyclopedia of Physical Science and Technology EN006C-252 June 27, 2001 14:15
Fluid Mixing 101
the flow pattern is completely disrupted, so the pressure
drop to these units is at least one velocity head. The rpm
can be adjusted to achieve almost any required level of
dispersion for contacting.
X. PILOT PLANT PROCEDURES
Pilot planting involves gathering sufficient information
from model runs so that the major controlling factors in
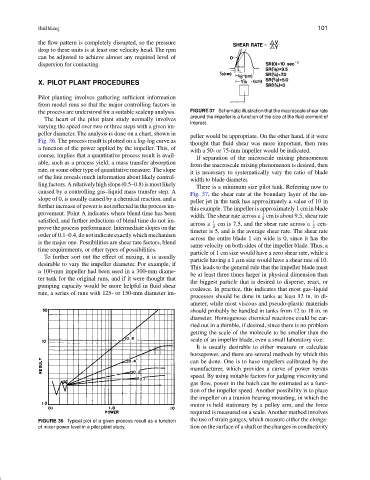
the process are understood for a suitable scaleup analysis. FIGURE 37 Schematic illustration that the macroscale shear rate
around the impeller is a function of the size of the fluid element of
The heart of the pilot plant study normally involves
interest.
varying the speed over two or three steps with a given im-
peller diameter. The analysis is done on a chart, shown in
peller would be appropriate. On the other hand, if it were
Fig. 36. The process result is plotted on a log-log curve as
thought that fluid shear was more important, then runs
a function of the power applied by the impeller. This, of
with a 50- or 75-mm impeller would be indicated.
course, implies that a quantitative process result is avail-
If separation of the microscale mixing phenomenon
able, such as a process yield, a mass transfer absorption
from the macroscale mixing phenomenon is desired, then
rate, or some other type of quantitative measure. The slope
it is necessary to systematically vary the ratio of blade
of the line reveals much information about likely control-
width to blade diameter.
ling factors. A relatively high slope (0.5–0.8) is most likely
There is a minimum size pilot tank. Referring now to
caused by a controlling gas–liquid mass transfer step. A
Fig. 37, the shear rate at the boundary layer of the im-
slope of 0, is usually caused by a chemical reaction, and a
peller jet in the tank has approximately a value of 10 in
further increase of power is not reflected in the process im-
this example. The impeller is approximately 1 cm in blade
provement. Point A indicates where blend time has been 1
width. The shear rate across a cm is about 9.5, shear rate
satisfied, and further reductions of blend time do not im- 1 8 1
across a cm is 7.5, and the shear rate across a cen-
prove the process performance. Intermediate slopes on the 4 2
timeter is 5, and is the average shear rate. The shear rate
order of 0.1–0.4, do not indicate exactly which mechanism
across the entire blade 1 cm wide is 0, since it has the
is the major one. Possibilities are shear rate factors, blend
same velocity on both sides of the impeller blade. Thus, a
time requirements, or other types of possibilities.
particle of 1 cm size would have a zero shear rate, while a
To further sort out the effect of mixing, it is usually
particle having a 1 µm size would have a shear rate of 10.
desirable to vary the impeller diameter. For example, if
This leads to the general rule that the impeller blade must
a 100-mm impeller had been used in a 300-mm diame-
be at least three times larger in physical dimension than
ter tank for the original runs, and if it were thought that
the biggest particle that is desired to disperse, react, or
pumping capacity would be more helpful in fluid shear
coalesce. In practice, this indicates that most gas–liquid
rate, a series of runs with 125- or 150-mm diameter im-
processes should be done in tanks at least 12 in. in di-
ameter, while most viscous and pseudo-plastic materials
should probably be handled in tanks from 12 to 18 in. in
diameter. Homogenous chemical reactions could be car-
ried out in a thimble, if desired, since there is no problem
getting the scale of the molecule to be smaller than the
scale of an impeller blade, even a small laboratory size.
It is usually desirable to either measure or calculate
horsepower, and there are several methods by which this
can be done. One is to have impellers calibrated by the
manufacturer, which provides a curve of power versus
speed. By using suitable factors for judging viscosity and
gas flow, power in the batch can be estimated as a func-
tion of the impeller speed. Another possibility is to place
the impeller on a trunion bearing mounting, in which the
motor is held stationary by a pulley arm, and the force
required is measured on a scale. Another method involves
FIGURE 36 Typical plot of a given process result as a function the use of strain gauges, which measure either the elonga-
of mixer power level in a pilot plant study. tion on the surface of a shaft or the changes in conductivity