
Page 164 - Engineered Interfaces in Fiber Reinforced Composites
P. 164
146 Engineered interfaces in fiber reinforced composites
1.2
1
z
a
5 0.4
a,
3
5 0.2
-
CI
C
'0 0.2 0.4 0.6 0.8 1
(b) Axial distance, z/L
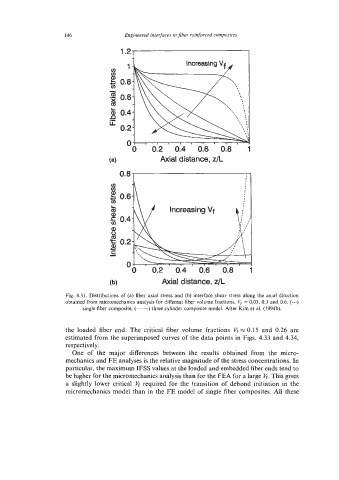
Fig. 4.31. Distributions of (a) fiber axial stress and (b) interface shear stress along the axial direction
obtained from micromechanics analysis for different fiber volume fractions, V, = 0.03, 0.3 and 0.6: (---)
single fiber composite; (-) three cylinder composite model. After Kim et al. (1994b).
the loaded fiber end. The critical fiber volume fractions vf M 0.15 and 0.26 are
estimated from the superimposed curves of the data points in Figs. 4.33 and 4.34,
respectively.
One of the major differences between the results obtained from the micro-
mechanics and FE analyses is the relative magnitude of the stress concentrations. In
particular, the maximum IFSS values at the loaded and embedded fiber ends tend to
be higher for the micromechanics analysis than for the FEA for a large vf. This gives
a slightly lower critical vf required for the transition of debond initiation in the
micromechanics model than in the FE model of single fiber composites. All these