
Page 367 - Engineering Electromagnetics, 8th Edition
P. 367
CHAPTER 10 Transmission Lines 349
(a)
(b)
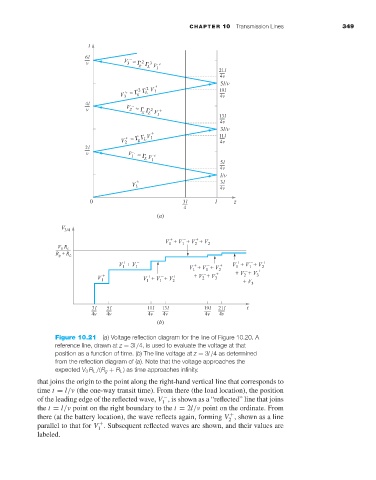
Figure 10.21 (a)Voltage reflection diagram for the line of Figure 10.20. A
reference line, drawn at z = 3l /4, is used to evaluate the voltage at that
position as a function of time. (b) The line voltage at z = 3l /4as determined
from the reflection diagram of (a). Note that the voltage approaches the
expected V 0 R L /(R g + R L )as time approaches infinity.
that joins the origin to the point along the right-hand vertical line that corresponds to
time t = l/ν (the one-way transit time). From there (the load location), the position
of the leading edge of the reflected wave, V ,is shown as a “reflected” line that joins
−
1
the t = l/ν point on the right boundary to the t = 2l/ν point on the ordinate. From
there (at the battery location), the wave reflects again, forming V , shown as a line
+
2
parallel to that for V . Subsequent reflected waves are shown, and their values are
+
1
labeled.