Page 186 - Environmental Nanotechnology Applications and Impacts of Nanomaterials
P. 186

Reactive Oxygen Species Generation on Nanoparticulate Material  171

        depending on the intrinsic acidity of the metal oxide [24, 28]. A simple
        formalism for characterizing the surface acidity versus pH, for quanti-
        fying the surface buffering capacity, the surface ion-exchange properties,
        and surface complexation capacity for cations, anions, and ligands is
        presented in Eqs. 28 and 29. The pH dependent changes in terms of the
        acid-base chemistry of surface hydroxyl functionalities (e.g., 	MOH,
        	TiOH, 	FeOH) can be treated as a conventional diprotic acid, although
        there may be more than one type of surface site undergoing protonation
                                                                       s
        and deprotonation (i.e., a distribution of surface acidity constants, K a .
                                           , the titration of a colloidal sus-
          In the case of nanoparticulate TiO 2
        pension with NaOH gives a classical titration curve for a diprotic acid
        as shown in Figure 5.14. Using the titration data of Figure 5.14, the sur-
        face acidity of TiO can be characterized is terms of two surface acidity
                         2
        constants as follows:
                              1
                                      k 1
                       , TiOH    m   , TiOH 1 H           1
                              2
                                      k 21
                                                                      (28)
                                  k 1
                                               s
                             s
                           K al 5                  pK al 5 2.4
                                  k
                                   21
                                      k 2           2    1
                                  m   , TiO 1 H
                        , TiOH
                                      k 22
                                                                      (29)
                             s
                                               s
                           K a2 5  k 2                 pK a2 5 8.0
                                  k
                                   22


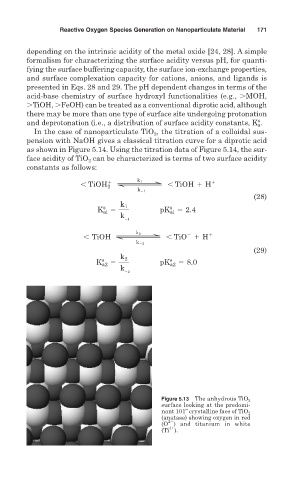
                                             Figure 5.13 The anhydrous TiO 2
                                             surface looking at the predomi-
                                             nant 101” crystalline face of TiO 2
                                             (anatase) showing oxygen in red
                                               2
                                             (O ) and titanium in white
                                               4
                                             (Ti ).
   181   182   183   184   185   186   187   188   189   190   191