
Page 188 - Environmental Nanotechnology Applications and Impacts of Nanomaterials
P. 188
Reactive Oxygen Species Generation on Nanoparticulate Material 173
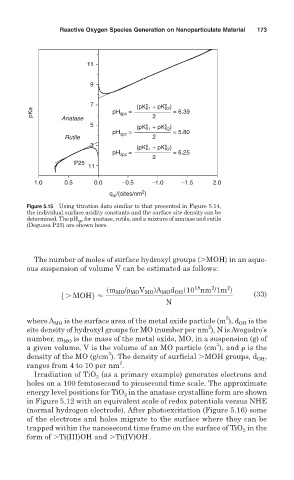
11
9
7 (pK a 1 + pK a 2 )
s
s
pKa Anatase pH zpc = 2 = 6.39
5 s s
(pK a 1 + pK a 2 )
pH zpc = = 5.80
Rutile 2
3 s s
(pK a 1 + pK a 2 )
pH zpc = = 6.25
2
P25
11
1.0 0.5 0.0 –0.5 –1.0 –1.5 2.0
2
q m /(sites/nm )
Figure 5.15 Using titration data similar to that presented in Figure 5.14,
the individual surface acidity constants and the surface site density can be
determined. The pH zpc for anatase, rutile, and a mixture of anatase and rutile
(Degussa P25) are shown here.
The number of moles of surface hydroxyl groups { MOH} in an aque-
ous suspension of volume V can be estimated as follows:
2
18
2
sm MO / MO V MO dA MO d OH s10 nm /1m d
5 . MOH6 < (33)
N
2
where A MO is the surface area of the metal oxide particle (m ), d OH is the
2
site density of hydroxyl groups for MO (number per nm ), N is Avogadro’s
number, m MO is the mass of the metal oxide, MO, in a suspension (g) of
3
a given volume, V is the volume of an MO particle (cm ), and is the
3
density of the MO (g/cm ). The density of surficial MOH groups, d OH ,
2
ranges from 4 to 10 per nm .
Irradiation of TiO 2 (as a primary example) generates electrons and
holes on a 100 femtosecond to picosecond time scale. The approximate
energy level positions for TiO 2 in the anatase crystalline form are shown
in Figure 5.12 with an equivalent scale of redox potentials versus NHE
(normal hydrogen electrode). After photoexcitation (Figure 5.16) some
of the electrons and holes migrate to the surface where they can be
trapped within the nanosecond time frame on the surface of TiO 2 in the
.
form of Ti(III)OH and Ti(IV)OH .