
Page 187 - Environmental Nanotechnology Applications and Impacts of Nanomaterials
P. 187
172 Principles and Methods
s
s
spK a1 1 pK a2 d
pH zpc 5 5 5.25 (30)
2
In the simplest case, at low ionic strength in the absence of added
cations or anions, the isoelectric point or “point of zero charge” is
described as follows in terms of the concentrations of the relevant sur-
face species as a function of pH:
2
1
[ . TiOH 2 ] 5 [ . TiO ] (31)
At a fixed ionic strength, the surface charge on TiO is a function of
2
the solution pH as follows [24, 28]:
'
0
` 5 ` spH 2 pH zpc d (32)
0
[ ]5const 'pH pH2pH zpc
,
The above acidity constants and the pH of zero point of charge, pH zpc
are given for quantum-sized TiO in the particle size range of 1.0 to 3.0 nm.
2
The titration data can be plotted with respect to the surface site density
as shown in Figure 5.15 to get more reliable estimates to the pH zpc for
most semiconductors listed in Tables 5.3 and 5.4.
11
9
P-25
p
pH 7 D = 2–4 nm D p = 30–60 nm
5
3
0 1 2 3 4 5 6
Volume/mL
Titration volume (mL)
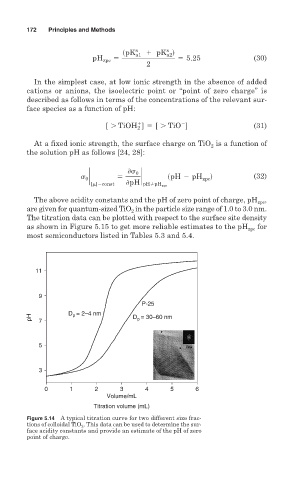
Figure 5.14 A typical titration curve for two different size frac-
tions of colloidal TiO 2 . This data can be used to determine the sur-
face acidity constants and provide an estimate of the pH of zero
point of charge.