
Page 189 - Environmental Nanotechnology Applications and Impacts of Nanomaterials
P. 189
174 Principles and Methods
–3
Conduction band Shallow trapping states –1
−
O2 + e → O −
–4 2
0
− −
>Ti(IV)OH + e cb → >Ti(III)OH
E (ev) –5 hn CH 3 CH 2 OH + h vb → CH 3 CHOH E (NHE)
+
1
+ +
>Ti(IV)OH + h vb → >Ti(IV)OH
–6
2
–7 Valence band
2
Solid TiO 2 TiO /Water
Figure 5.16 Energy level positions for the photoexcitation of TiO 2
( E g = 3.2 eV) in the anatase form relative to the solid-solution
interface redox potentials for key steps and possible electron
transfer reactions. Surface trapping states within the bandgap
energy domain are indicated.
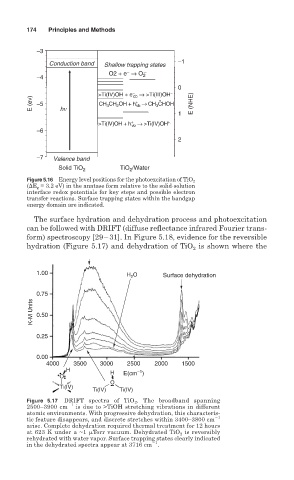
The surface hydration and dehydration process and photoexcitation
can be followed with DRIFT (diffuse reflectance infrared Fourier trans-
form) spectroscopy [29 31]. In Figure 5.18, evidence for the reversible
hydration (Figure 5.17) and dehydration of TiO 2 is shown where the
1.00 H 2 O Surface dehydration
0.75
K-M Units 0.50
0.25
0.00
4000 3500 3000 2500 2000 1500
H H −1
O E(cm )
O
Ti(IV)
Ti(IV) Ti(IV)
Figure 5.17 DRIFT spectra of TiO 2 . The broadband spanning
2500–3900 cm 1 is due to >TiOH stretching vibrations in different
atomic environments. With progressive dehydration, this characteris-
tic feature disappears, and discrete stretches within 3400–3800 cm 1
arise. Complete dehydration required thermal treatment for 12 hours
at 623 K under a ~1 Torr vacuum. Dehydrated TiO 2 is reversibly
rehydrated with water vapor. Surface trapping states clearly indicated
1
in the dehydrated spectra appear at 3716 cm .