
Page 428 - Excel 2007 Bible
P. 428
26_044039 ch20.qxp 11/21/06 11:11 AM Page 385
n Right-click the chart element and choose Format xxxx from the shortcut menu (where xxxx is the
name of the element).
n Select a chart element and then choose Chart Tools ➪ Format ➪ Current Selection ➪ Format
Selection.
n Select a chart element and press Ctrl+1.
Any of these methods displays a tabbed Format dialog box that enables you to make many changes to the
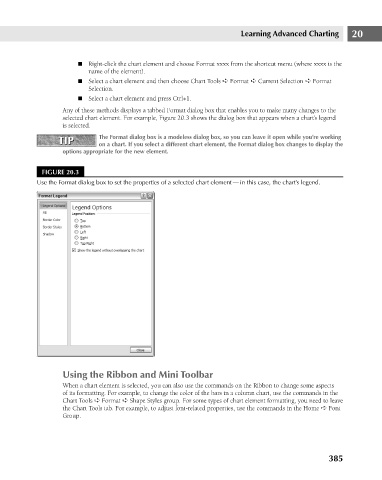
selected chart element. For example, Figure 20.3 shows the dialog box that appears when a chart’s legend
is selected.
The Format dialog box is a modeless dialog box, so you can leave it open while you’re working
TIP
TIP
on a chart. If you select a different chart element, the Format dialog box changes to display the
options appropriate for the new element.
FIGURE 20.3
Use the Format dialog box to set the properties of a selected chart element — in this case, the chart’s legend.
Using the Ribbon and Mini Toolbar Learning Advanced Charting 20
When a chart element is selected, you can also use the commands on the Ribbon to change some aspects
of its formatting. For example, to change the color of the bars in a column chart, use the commands in the
Chart Tools ➪ Format ➪ Shape Styles group. For some types of chart element formatting, you need to leave
the Chart Tools tab. For example, to adjust font-related properties, use the commands in the Home ➪ Font
Group.
385