
Page 423 - Excel 2007 Bible
P. 423
25_044039 ch19.qxp 11/21/06 11:10 AM Page 380
Part III
Creating Charts and Graphics
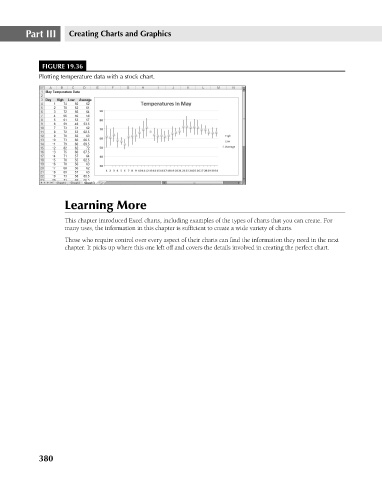
FIGURE 19.36
Plotting temperature data with a stock chart.
Learning More
This chapter introduced Excel charts, including examples of the types of charts that you can create. For
many uses, the information in this chapter is sufficient to create a wide variety of charts.
Those who require control over every aspect of their charts can find the information they need in the next
chapter. It picks up where this one left off and covers the details involved in creating the perfect chart.
380