Page 419 - Excel 2007 Bible
P. 419

25_044039 ch19.qxp  11/21/06  11:10 AM  Page 376
                                  Part III
                                              Creating Charts and Graphics
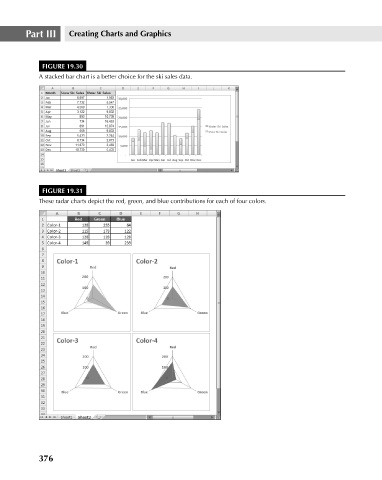
                                       FIGURE 19.30
                                      A stacked bar chart is a better choice for the ski sales data.
                                       FIGURE 19.31
                                      These radar charts depict the red, green, and blue contributions for each of four colors.


                                      376
   414   415   416   417   418   419   420   421   422   423   424