
Page 415 - Excel 2007 Bible
P. 415
25_044039 ch19.qxp 11/21/06 11:10 AM Page 372
Part III
Creating Charts and Graphics
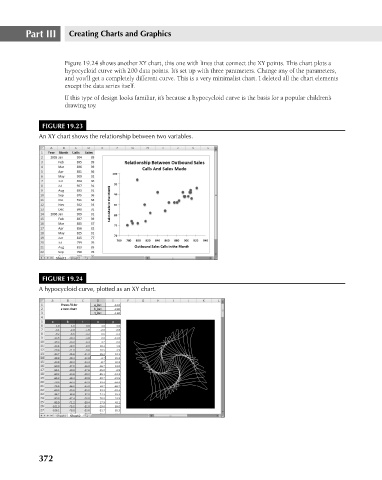
Figure 19.24 shows another XY chart, this one with lines that connect the XY points. This chart plots a
hypocycloid curve with 200 data points. It’s set up with three parameters. Change any of the parameters,
and you’ll get a completely different curve. This is a very minimalist chart. I deleted all the chart elements
except the data series itself.
If this type of design looks familiar, it’s because a hypocycloid curve is the basis for a popular children’s
drawing toy.
FIGURE 19.23
An XY chart shows the relationship between two variables.
FIGURE 19.24
A hypocycloid curve, plotted as an XY chart.
372