
Page 412 - Excel 2007 Bible
P. 412
25_044039 ch19.qxp 11/21/06 11:10 AM Page 369
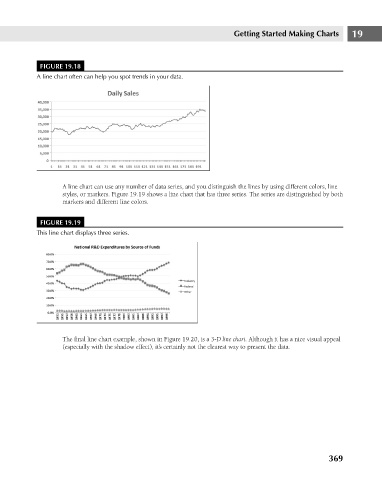
FIGURE 19.18
A line chart often can help you spot trends in your data.
A line chart can use any number of data series, and you distinguish the lines by using different colors, line
styles, or markers. Figure 19.19 shows a line chart that has three series. The series are distinguished by both
markers and different line colors. Getting Started Making Charts 19
FIGURE 19.19
This line chart displays three series.
The final line chart example, shown in Figure 19.20, is a 3-D line chart. Although it has a nice visual appeal
(especially with the shadow effect), it’s certainly not the clearest way to present the data.
369