Page 416 - Excel 2007 Bible
P. 416

25_044039 ch19.qxp  11/21/06  11:10 AM  Page 373
                                                                                            Getting Started Making Charts
                                             Area charts
                                             Think of an area chart as a line chart in which the area below the line has been colored in. Figure 19.25
                                             shows an example of a stacked area chart. Stacking the data series enables you to see clearly the total, plus
                                             the contribution by each series.
                                                       A workbook that contains the charts in this section is available on the companion CD-ROM.
                                      ON  the  CD-ROM
                                      ON  the  CD-ROM
                                                       The file is named area charts.xlsx.
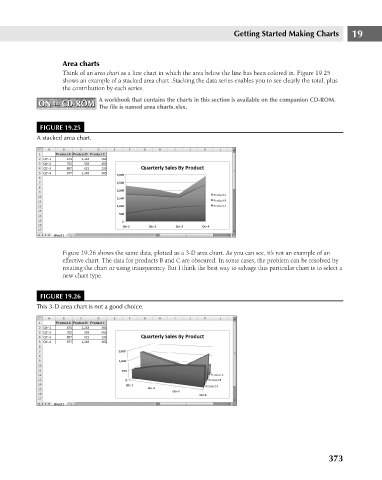
                                      FIGURE 19.25
                                     A stacked area chart.
                                             Figure 19.26 shows the same data, plotted as a 3-D area chart. As you can see, it’s not an example of an  19
                                             effective chart. The data for products B and C are obscured. In some cases, the problem can be resolved by
                                             rotating the chart or using transparency. But I think the best way to salvage this particular chart is to select a
                                             new chart type.
                                      FIGURE 19.26
                                     This 3-D area chart is not a good choice.


                                                                                                                      373
   411   412   413   414   415   416   417   418   419   420   421