
Page 421 - Excel 2007 Bible
P. 421
25_044039 ch19.qxp 11/21/06 11:10 AM Page 378
Part III
Creating Charts and Graphics
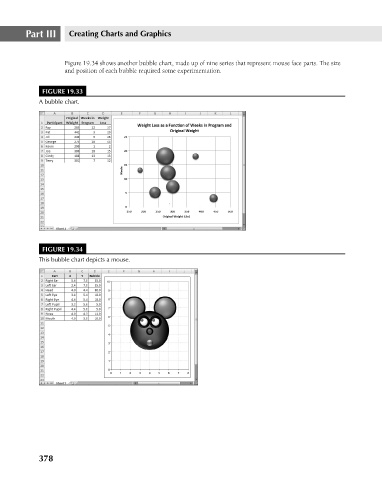
Figure 19.34 shows another bubble chart, made up of nine series that represent mouse face parts. The size
and position of each bubble required some experimentation.
FIGURE 19.33
A bubble chart.
FIGURE 19.34
This bubble chart depicts a mouse.
378