
Page 418 - Excel 2007 Bible
P. 418
25_044039 ch19.qxp 11/21/06 11:10 AM Page 375
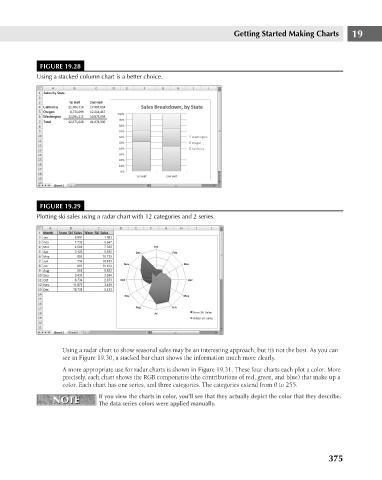
FIGURE 19.28
Using a stacked column chart is a better choice.
FIGURE 19.29 Getting Started Making Charts 19
Plotting ski sales using a radar chart with 12 categories and 2 series.
Using a radar chart to show seasonal sales may be an interesting approach, but it’s not the best. As you can
see in Figure 19.30, a stacked bar chart shows the information much more clearly.
A more appropriate use for radar charts is shown in Figure 19.31. These four charts each plot a color. More
precisely, each chart shows the RGB components (the contributions of red, green, and blue) that make up a
color. Each chart has one series, and three categories. The categories extend from 0 to 255.
NOTE If you view the charts in color, you’ll see that they actually depict the color that they describe.
NOTE
The data series colors were applied manually.
375