
Page 422 - Excel 2007 Bible
P. 422
25_044039 ch19.qxp 11/21/06 11:10 AM Page 379
Getting Started Making Charts
Stock charts
Stock charts are most useful for displaying stock-market information. These charts require three to five data
series, depending on the subtype. This chart type is listed in the Other Charts category.
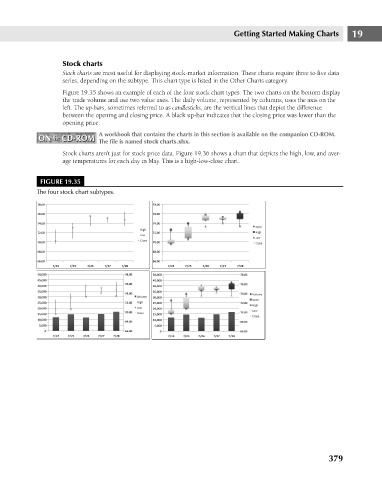
Figure 19.35 shows an example of each of the four stock chart types. The two charts on the bottom display
the trade volume and use two value axes. The daily volume, represented by columns, uses the axis on the
left. The up-bars, sometimes referred to as candlesticks, are the vertical lines that depict the difference
between the opening and closing price. A black up-bar indicates that the closing price was lower than the
opening price.
A workbook that contains the charts in this section is available on the companion CD-ROM.
ON the CD-ROM
ON the CD-ROM
The file is named stock charts.xlsx.
Stock charts aren’t just for stock price data. Figure 19.36 shows a chart that depicts the high, low, and aver-
age temperatures for each day in May. This is a high-low-close chart.
FIGURE 19.35
The four stock chart subtypes.
379 19