
Page 430 - Excel 2007 Bible
P. 430
26_044039 ch20.qxp 11/21/06 11:11 AM Page 387
Resetting Chart Element Formatting
f you go overboard formatting a chart element, you can always reset it to its original state. Just select the ele-
Iment and choose Chart Tools ➪ Format ➪ Current Selection ➪ Reset to Match Style. Or, right-click the
chart element and choose Reset To Match Style from the shortcut menu.
To reset all formatting changes in the entire chart, select the Chart Area before you issue the Reset to Match
Style command.
Modifying the Plot Area
The Plot Area is the part of the chart that contains the actual chart.
If you set the Shape Fill property to No Fill, the Plot Area will be transparent. Therefore, the fill
TIP
TIP
color applied to the Chart Area will show through.
You can move and resize the Plot Area if you like. Select the Plot Area and then drag a border to move it. To
change the size of the Plot Area, drag on one of the corner handles. Learning Advanced Charting 20
Different chart types vary in how they respond to changes in the Plot Area dimensions. For example, you
can’t change the relative dimensions of the Plot Area of a pie chart or a radar chart. The Plot Area of these
charts is always square. But with other chart types, you can change the aspect ratio of the Plot Area by
changing either the height or the width.
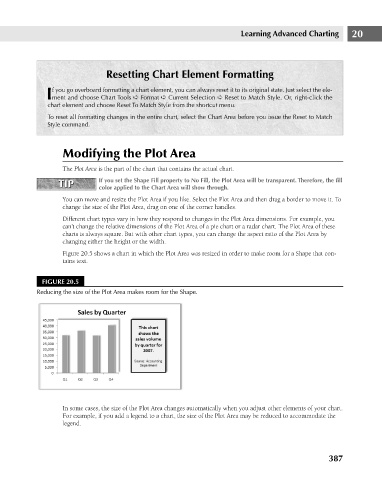
Figure 20.5 shows a chart in which the Plot Area was resized in order to make room for a Shape that con-
tains text.
FIGURE 20.5
Reducing the size of the Plot Area makes room for the Shape.
In some cases, the size of the Plot Area changes automatically when you adjust other elements of your chart.
For example, if you add a legend to a chart, the size of the Plot Area may be reduced to accommodate the
legend.
387