
Page 429 - Excel 2007 Bible
P. 429
26_044039 ch20.qxp 11/21/06 11:11 AM Page 386
Part III
Creating Charts and Graphics
If you need to adjust a text element in a chart, it may be more efficient to right-click the ele-
TIP
TIP
ment and use the Mini Toolbar that pop up.
The Ribbon controls do not comprise a comprehensive set of tools for chart elements. The Format dialog
box presents many additional options. But then again, the Format dialog box is missing some formatting
options. For example, if you want to apply Glow or Soft Edges formatting, you need to use the Ribbon
commands.
Modifying the Chart Area
The Chart Area is an object that contains all other elements in the chart. You can think of it as a chart’s mas-
ter background or container.
The only modifications that you can make to the Chart Area are cosmetic. You can change its fill color, out-
line, or effects.
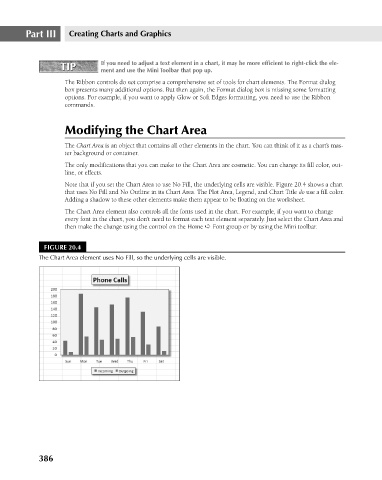
Note that if you set the Chart Area to use No Fill, the underlying cells are visible. Figure 20.4 shows a chart
that uses No Fill and No Outline in its Chart Area. The Plot Area, Legend, and Chart Title do use a fill color.
Adding a shadow to these other elements make them appear to be floating on the worksheet.
The Chart Area element also controls all the fonts used in the chart. For example, if you want to change
every font in the chart, you don’t need to format each text element separately. Just select the Chart Area and
then make the change using the control on the Home ➪ Font group or by using the Mini toolbar.
FIGURE 20.4
The Chart Area element uses No Fill, so the underlying cells are visible.
386