
Page 463 - Excel 2007 Bible
P. 463
26_044039 ch20.qxp 11/21/06 11:11 AM Page 420
Part III
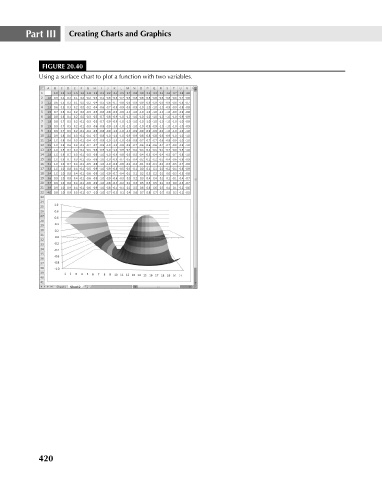
FIGURE 20.40
Using a surface chart to plot a function with two variables.
420 Creating Charts and Graphics