
Page 462 - Excel 2007 Bible
P. 462
26_044039 ch20.qxp 11/21/06 11:11 AM Page 419
Learning Advanced Charting
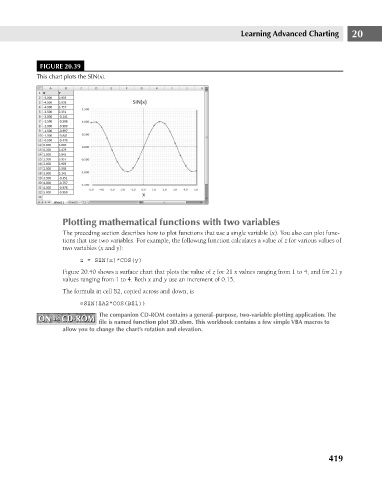
FIGURE 20.39
This chart plots the SIN(x).
Plotting mathematical functions with two variables 20
The preceding section describes how to plot functions that use a single variable (x). You also can plot func-
tions that use two variables. For example, the following function calculates a value of z for various values of
two variables (x and y):
z = SIN(x)*COS(y)
Figure 20.40 shows a surface chart that plots the value of z for 21 x values ranging from 1 to 4, and for 21 y
values ranging from 1 to 4. Both x and y use an increment of 0.15.
The formula in cell B2, copied across and down, is
=SIN($A2*COS(B$1))
The companion CD-ROM contains a general–purpose, two-variable plotting application. The
ON the CD-ROM file is named function plot 3D.xlsm. This workbook contains a few simple VBA macros to
ON the CD-ROM
allow you to change the chart’s rotation and elevation.
419