
Page 459 - Excel 2007 Bible
P. 459
26_044039 ch20.qxp 11/21/06 11:11 AM Page 416
Part III
Creating Charts and Graphics
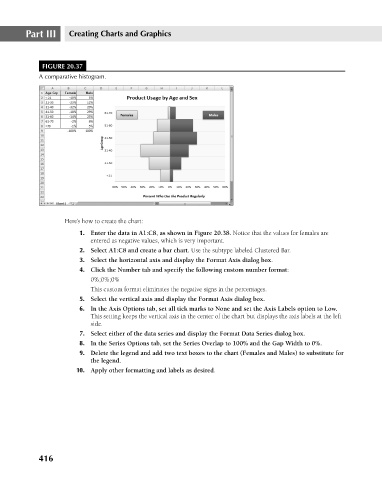
FIGURE 20.37
A comparative histogram.
Here’s how to create the chart:
1. Enter the data in A1:C8, as shown in Figure 20.38. Notice that the values for females are
entered as negative values, which is very important.
2. Select A1:C8 and create a bar chart. Use the subtype labeled Clustered Bar.
3. Select the horizontal axis and display the Format Axis dialog box.
4. Click the Number tab and specify the following custom number format:
0%;0%;0%
This custom format eliminates the negative signs in the percentages.
5. Select the vertical axis and display the Format Axis dialog box.
6. In the Axis Options tab, set all tick marks to None and set the Axis Labels option to Low.
This setting keeps the vertical axis in the center of the chart but displays the axis labels at the left
side.
7. Select either of the data series and display the Format Data Series dialog box.
8. In the Series Options tab, set the Series Overlap to 100% and the Gap Width to 0%.
9. Delete the legend and add two text boxes to the chart (Females and Males) to substitute for
the legend.
10. Apply other formatting and labels as desired.
416