
Page 454 - Excel 2007 Bible
P. 454
26_044039 ch20.qxp 11/21/06 11:11 AM Page 411
3. In the left side of the Insert Chart dialog box, select Templates. Excel displays an icon for
each custom template that has been created.
4. Click the icon that represents the template you want to use and click OK. Excel creates the
You can also apply a template to an existing chart. Select the chart and use Chart Tools ➪
NOTE
NOTE
Design ➪ Change Chart Type.
Learning Some Chart-Making Tricks
This section describes some interesting (and perhaps useful) chart-making tricks. Some of these tricks use
little-known features, and several tricks enable you to make charts that you may have considered impossible
to create.
Creating picture charts
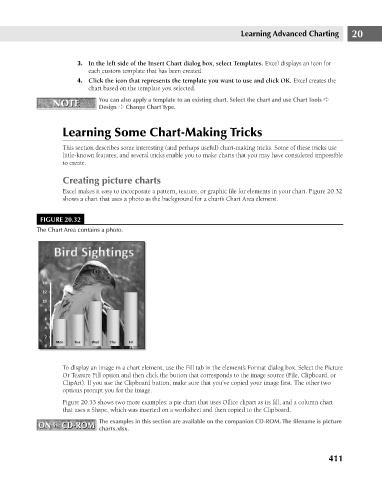
Excel makes it easy to incorporate a pattern, texture, or graphic file for elements in your chart. Figure 20.32
shows a chart that uses a photo as the background for a chart’s Chart Area element.
FIGURE 20.32 chart based on the template you selected. Learning Advanced Charting 20
The Chart Area contains a photo.
To display an image in a chart element, use the Fill tab in the element’s Format dialog box. Select the Picture
Or Texture Fill option and then click the button that corresponds to the image source (File, Clipboard, or
ClipArt). If you use the Clipboard button, make sure that you’ve copied your image first. The other two
options prompt you for the image.
Figure 20.33 shows two more examples: a pie chart that uses Office clipart as its fill, and a column chart
that uses a Shape, which was inserted on a worksheet and then copied to the Clipboard.
The examples in this section are available on the companion CD-ROM. The filename is picture
ON the CD-ROM charts.xlsx.
ON the CD-ROM
411