
Page 453 - Excel 2007 Bible
P. 453
26_044039 ch20.qxp 11/21/06 11:11 AM Page 410
Part III
Creating Charts and Graphics
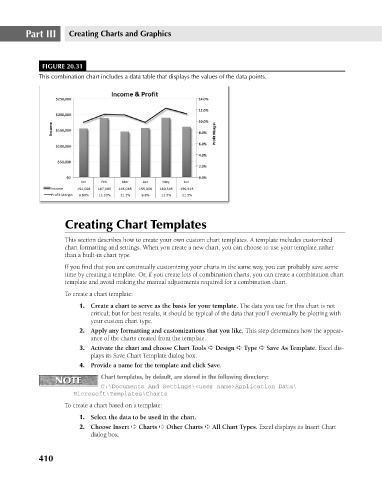
FIGURE 20.31
This combination chart includes a data table that displays the values of the data points.
Creating Chart Templates
This section describes how to create your own custom chart templates. A template includes customized
chart formatting and settings. When you create a new chart, you can choose to use your template rather
than a built-in chart type.
If you find that you are continually customizing your charts in the same way, you can probably save some
time by creating a template. Or, if you create lots of combination charts, you can create a combination chart
template and avoid making the manual adjustments required for a combination chart.
To create a chart template:
1. Create a chart to serve as the basis for your template. The data you use for this chart is not
critical; but for best results, it should be typical of the data that you’ll eventually be plotting with
your custom chart type.
2. Apply any formatting and customizations that you like. This step determines how the appear-
ance of the charts created from the template.
3. Activate the chart and choose Chart Tools ➪ Design ➪ Type ➪ Save As Template. Excel dis-
plays its Save Chart Template dialog box.
4. Provide a name for the template and click Save.
NOTE Chart templates, by default, are stored in the following directory:
NOTE
C:\Documents And Settings\<user name>Application Data\
Microsoft\Templates\Charts
To create a chart based on a template:
1. Select the data to be used in the chart.
2. Choose Insert ➪ Charts ➪ Other Charts ➪ All Chart Types. Excel displays its Insert Chart
dialog box.
410