
Page 451 - Excel 2007 Bible
P. 451
26_044039 ch20.qxp 11/21/06 11:11 AM Page 408
Part III
Creating Charts and Graphics
4. With the Precipitation data series still selected, choose Chart Tools ➪ Design ➪ Type ➪
5. In the Change Chart Type dialog box, select the Line type and click OK.
Figure 20.29 shows the modified chart. The Precipitation data appears as a line, and it uses the Value Axis
on the right.
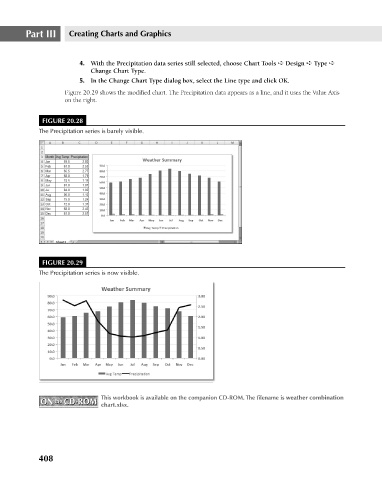
FIGURE 20.28
The Precipitation series is barely visible.
FIGURE 20.29 Change Chart Type.
The Precipitation series is now visible.
This workbook is available on the companion CD-ROM. The filename is weather combination
ON the CD-ROM chart.xlsx.
ON the CD-ROM
408