
Page 449 - Excel 2007 Bible
P. 449
26_044039 ch20.qxp 11/21/06 11:11 AM Page 406
Part III
Creating Charts and Graphics
Modifying 3-D charts
3-D charts have a few additional elements that you can customize. For example, most 3-D charts have a
floor and walls, and the true 3-D charts also have an additional axis. You can select these chart elements and
format them to your liking using the Format dialog box.
One area in which 3-D charts differ from Excel’s 2-D charts is in the perspective — or viewpoint —from
which you see the chart. In some cases, the data may be viewed better if you change the order of the series.
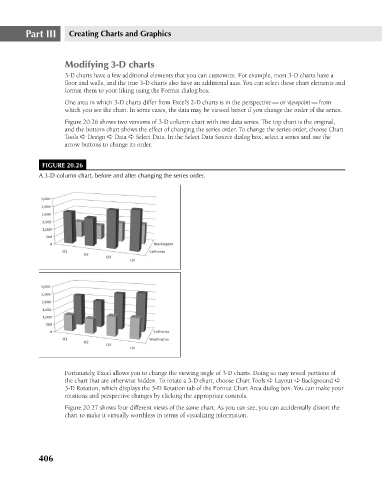
Figure 20.26 shows two versions of 3-D column chart with two data series. The top chart is the original,
and the bottom chart shows the effect of changing the series order. To change the series order, choose Chart
Tools ➪ Design ➪ Data ➪ Select Data. In the Select Data Source dialog box, select a series and use the
arrow buttons to change its order.
FIGURE 20.26
A 3-D column chart, before and after changing the series order.
Fortunately, Excel allows you to change the viewing angle of 3-D charts. Doing so may reveal portions of
the chart that are otherwise hidden. To rotate a 3-D chart, choose Chart Tools ➪ Layout ➪ Background ➪
3-D Rotation, which displays the 3-D Rotation tab of the Format Chart Area dialog box. You can make your
rotations and perspective changes by clicking the appropriate controls.
Figure 20.27 shows four different views of the same chart. As you can see, you can accidentally distort the
chart to make it virtually worthless in terms of visualizing information.
406