
Page 445 - Excel 2007 Bible
P. 445
26_044039 ch20.qxp 11/21/06 11:11 AM Page 402
Part III
Creating Charts and Graphics
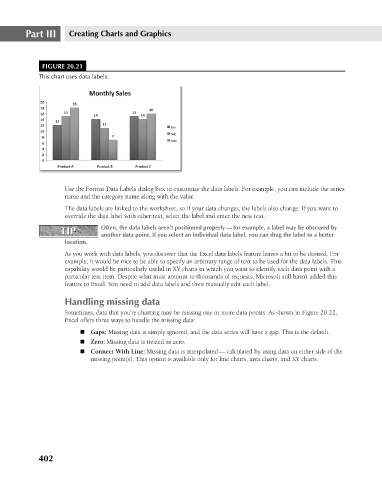
FIGURE 20.21
This chart uses data labels.
Use the Format Data Labels dialog box to customize the data labels. For example, you can include the series
name and the category name along with the value.
The data labels are linked to the worksheet, so if your data changes, the labels also change. If you want to
override the data label with other text, select the label and enter the new text.
TIP Often, the data labels aren’t positioned properly — for example, a label may be obscured by
TIP
another data point. If you select an individual data label, you can drag the label to a better
location.
As you work with data labels, you discover that the Excel data labels feature leaves a bit to be desired. For
example, it would be nice to be able to specify an arbitrary range of text to be used for the data labels. This
capability would be particularly useful in XY charts in which you want to identify each data point with a
particular text item. Despite what must amount to thousands of requests, Microsoft still hasn’t added this
feature to Excel. You need to add data labels and then manually edit each label.
Handling missing data
Sometimes, data that you’re charting may be missing one or more data points. As shown in Figure 20.22,
Excel offers three ways to handle the missing data:
n Gaps: Missing data is simply ignored, and the data series will have a gap. This is the default.
n Zero: Missing data is treated as zero.
n Connect With Line: Missing data is interpolated — calculated by using data on either side of the
missing point(s). This option is available only for line charts, area charts, and XY charts.
402