
Page 446 - Excel 2007 Bible
P. 446
26_044039 ch20.qxp 11/21/06 11:11 AM Page 403
Learning Advanced Charting
FIGURE 20.22
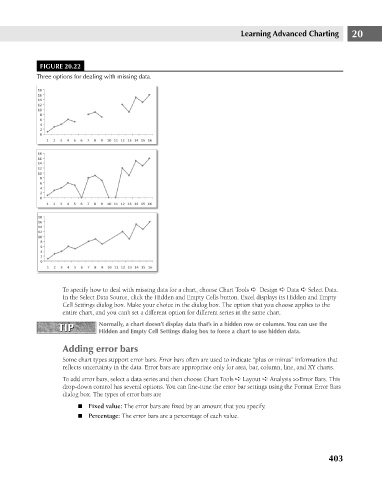
Three options for dealing with missing data.
To specify how to deal with missing data for a chart, choose Chart Tools ➪ Design ➪ Data ➪ Select Data. 20
In the Select Data Source, click the Hidden and Empty Cells button. Excel displays its Hidden and Empty
Cell Settings dialog box. Make your choice in the dialog box. The option that you choose applies to the
entire chart, and you can’t set a different option for different series in the same chart.
TIP Normally, a chart doesn’t display data that’s in a hidden row or columns. You can use the
TIP
Hidden and Empty Cell Settings dialog box to force a chart to use hidden data.
Adding error bars
Some chart types support error bars. Error bars often are used to indicate “plus or minus” information that
reflects uncertainty in the data. Error bars are appropriate only for area, bar, column, line, and XY charts.
To add error bars, select a data series and then choose Chart Tools ➪ Layout ➪ Analysis >>Error Bars. This
drop-down control has several options. You can fine-tune the error bar settings using the Format Error Bars
dialog box. The types of error bars are
n Fixed value: The error bars are fixed by an amount that you specify.
n Percentage: The error bars are a percentage of each value.
403