
Page 442 - Excel 2007 Bible
P. 442
26_044039 ch20.qxp 11/21/06 11:11 AM Page 399
FIGURE 20.18
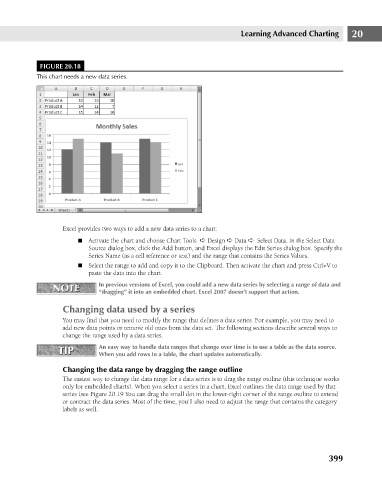
This chart needs a new data series.
Excel provides two ways to add a new data series to a chart: Learning Advanced Charting 20
n Activate the chart and choose Chart Tools ➪ Design ➪ Data ➪ Select Data. In the Select Data
Source dialog box, click the Add button, and Excel displays the Edit Series dialog box. Specify the
Series Name (as a cell reference or text) and the range that contains the Series Values.
n Select the range to add and copy it to the Clipboard. Then activate the chart and press Ctrl+V to
paste the data into the chart.
NOTE In previous versions of Excel, you could add a new data series by selecting a range of data and
NOTE
“dragging” it into an embedded chart. Excel 2007 doesn’t support that action.
Changing data used by a series
You may find that you need to modify the range that defines a data series. For example, you may need to
add new data points or remove old ones from the data set. The following sections describe several ways to
change the range used by a data series.
TIP An easy way to handle data ranges that change over time is to use a table as the data source.
TIP
When you add rows to a table, the chart updates automatically.
Changing the data range by dragging the range outline
The easiest way to change the data range for a data series is to drag the range outline (this technique works
only for embedded charts). When you select a series in a chart, Excel outlines the data range used by that
series (see Figure 20.19 You can drag the small dot in the lower-right corner of the range outline to extend
or contract the data series. Most of the time, you’ll also need to adjust the range that contains the category
labels as well.
399