
Page 438 - Excel 2007 Bible
P. 438
26_044039 ch20.qxp 11/21/06 11:11 AM Page 395
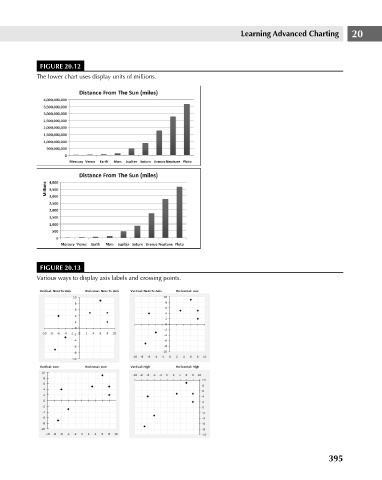
FIGURE 20.12
The lower chart uses display units of millions.
FIGURE 20.13 Learning Advanced Charting 20
Various ways to display axis labels and crossing points.
395