Page 436 - Excel 2007 Bible
P. 436

26_044039 ch20.qxp  11/21/06  11:11 AM  Page 393
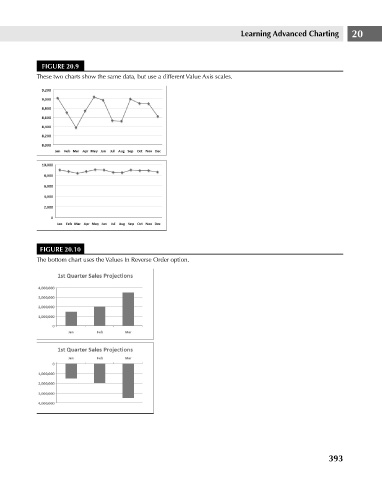
                                       FIGURE 20.9
                                     These two charts show the same data, but use a different Value Axis scales.


                                      FIGURE 20.10                                            Learning Advanced Charting     20
                                     The bottom chart uses the Values In Reverse Order option.


                                                                                                                      393
   431   432   433   434   435   436   437   438   439   440   441