
Page 443 - Excel 2007 Bible
P. 443
26_044039 ch20.qxp 11/21/06 11:11 AM Page 400
Part III
Creating Charts and Graphics
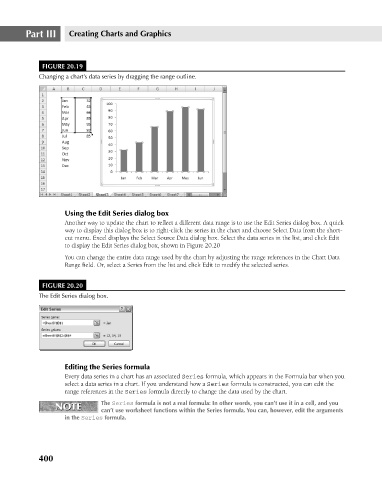
FIGURE 20.19
Changing a chart’s data series by dragging the range outline.
Using the Edit Series dialog box
Another way to update the chart to reflect a different data range is to use the Edit Series dialog box. A quick
way to display this dialog box is to right-click the series in the chart and choose Select Data from the short-
cut menu. Excel displays the Select Source Data dialog box. Select the data series in the list, and click Edit
to display the Edit Series dialog box, shown in Figure 20.20
You can change the entire data range used by the chart by adjusting the range references in the Chart Data
Range field. Or, select a Series from the list and click Edit to modify the selected series.
FIGURE 20.20
The Edit Series dialog box.
Editing the Series formula
Every data series in a chart has an associated Series formula, which appears in the Formula bar when you
select a data series in a chart. If you understand how a Series formula is constructed, you can edit the
range references in the Series formula directly to change the data used by the chart.
NOTE
NOTE The Series formula is not a real formula: In other words, you can’t use it in a cell, and you
can’t use worksheet functions within the Series formula. You can, however, edit the arguments
in the Series formula.
400