Page 448 - Excel 2007 Bible
P. 448

26_044039 ch20.qxp  11/21/06  11:11 AM  Page 405
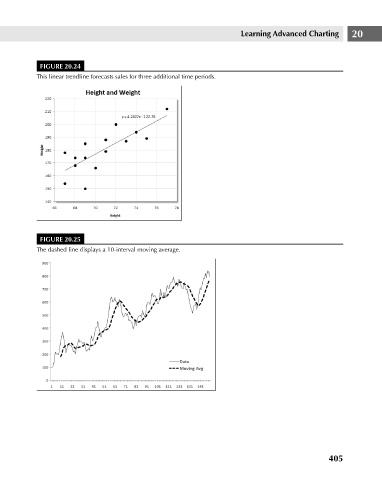
                                      FIGURE 20.24
                                     This linear trendline forecasts sales for three additional time periods.

                                      FIGURE 20.25                                            Learning Advanced Charting     20
                                     The dashed line displays a 10-interval moving average.


                                                                                                                      405
   443   444   445   446   447   448   449   450   451   452   453