
Page 452 - Excel 2007 Bible
P. 452
26_044039 ch20.qxp 11/21/06 11:11 AM Page 409
In some cases, you can’t combine chart types. For example, you can’t create a combination
NOTE
NOTE
chart that involves a bubble chart or a 3-D chart. If you choose an incompatible chart type for
the series, Excel lets you know.
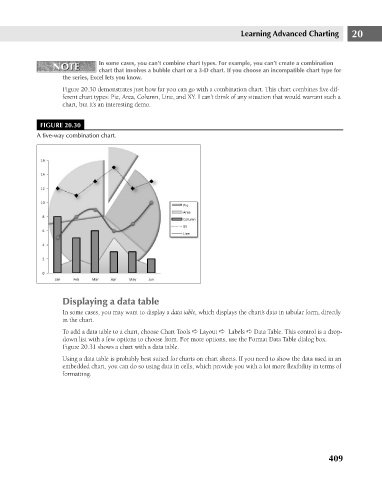
Figure 20.30 demonstrates just how far you can go with a combination chart. This chart combines five dif-
ferent chart types: Pie, Area, Column, Line, and XY. I can’t think of any situation that would warrant such a
chart, but it’s an interesting demo.
FIGURE 20.30
A five-way combination chart.
Displaying a data table Learning Advanced Charting 20
In some cases, you may want to display a data table, which displays the chart’s data in tabular form, directly
in the chart.
To add a data table to a chart, choose Chart Tools ➪ Layout ➪ Labels ➪ Data Table. This control is a drop-
down list with a few options to choose from. For more options, use the Format Data Table dialog box.
Figure 20.31 shows a chart with a data table.
Using a data table is probably best suited for charts on chart sheets. If you need to show the data used in an
embedded chart, you can do so using data in cells, which provide you with a lot more flexibility in terms of
formatting.
409