
Page 455 - Excel 2007 Bible
P. 455
26_044039 ch20.qxp 11/21/06 11:11 AM Page 412
Part III
Creating Charts and Graphics
Using images in a chart offers unlimited potential for creativity. The key, of course, is to resist the temptation
to go overboard. A chart’s primary goal is to convey information, not to impress the viewer with your artis-
tic skills.
Using images, especially photos, in charts can dramatically increase the size of your work-
CAUTION
CAUTION
books.
Creating a thermometer chart
You’re probably familiar with a “thermometer” type display that shows the percentage of a task that’s com-
pleted. Creating such a display in Excel is very easy. The trick involves creating a chart that uses a single cell
(which holds a percentage value) as a data series.
Figure 20.34 shows a worksheet set up to track daily progress toward a goal: 1,000 new customers in a 15-
day period. Cell B18 contains the goal value, and cell B19 contains a simple formula that calculates the
sum. Cell B21 contains a formula that calculates the percent of goal:
=B19/B18
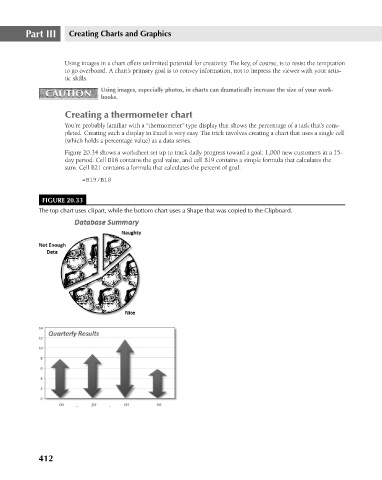
FIGURE 20.33
The top chart uses clipart, while the bottom chart uses a Shape that was copied to the Clipboard.
412