
Page 461 - Excel 2007 Bible
P. 461
26_044039 ch20.qxp 11/21/06 11:11 AM Page 418
Part III
Creating Charts and Graphics
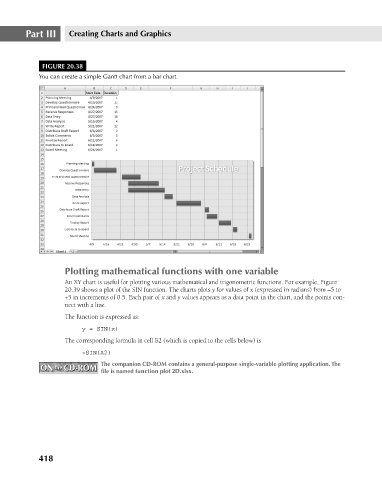
FIGURE 20.38
You can create a simple Gantt chart from a bar chart.
Plotting mathematical functions with one variable
An XY chart is useful for plotting various mathematical and trigonometric functions. For example, Figure
20.39 shows a plot of the SIN function. The charts plots y for values of x (expressed in radians) from –5 to
+5 in increments of 0.5. Each pair of x and y values appears as a data point in the chart, and the points con-
nect with a line.
The function is expressed as:
y = SIN(x)
The corresponding formula in cell B2 (which is copied to the cells below) is
=SIN(A2)
The companion CD-ROM contains a general-purpose single-variable plotting application. The
ON the CD-ROM file is named function plot 2D.xlsx.
ON the CD-ROM
418