
Page 130 - Excel Data Analysis
P. 130
07 537547 Ch06.qxd 3/4/03 12:09 PM Page 116
EXCEL DATA ANALYSIS
ADD OR CHANGE NEW DATA TO A CHART
f you change the range of values for your data analysis, columns as the data series range, you can add a new data
you can redefine the range of data Excel uses to display series by selecting a new column. For example, if you create
I values on the chart. You can either expand the range of a new column containing Landscaping expenses, you can
values on the chart, or you can add an additional data create a new data series on the chart.
series. You use the Source Data dialog box to both expand a If you expand a data range to include an additional data
data range and add a new data series. When you expand a series, Excel automatically creates a new data series. You can
data range, you typically expand the range of values that customize any data series name or range in the Series tab.
each data series uses in the chart. For example, if your chart
contains the monthly expenses for January through June, to Excel allows you to add a maximum of 255 data series to
add the expenses for July you expand the data range to most of the default chart types. The only exception is the
include July. pie chart, which only allows you to use one data series. If
you create a pie chart using multiple data series, Excel
Excel groups related data values together in a data series. ignores all but the first data series. For more about the
Typically, a data series refers to the data values that appear various chart types in Excel, see the section "Chart Basics."
in rows or columns on a worksheet. If your chart uses
ADD OR CHANGE NEW DATA TO A CHART
=Sheet1!$A$1:$F$8
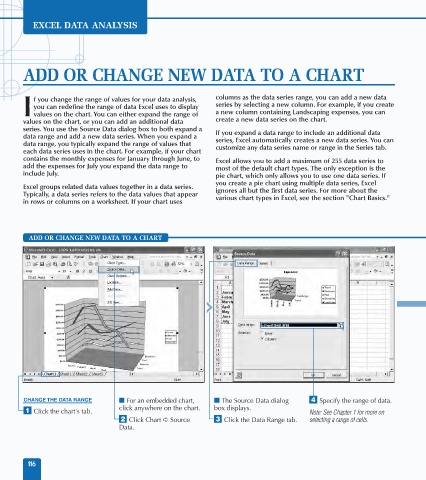
CHANGE THE DATA RANGE ■ For an embedded chart, ■ The Source Data dialog › Specify the range of data.
click anywhere on the chart. box displays.
⁄ Click the chart's tab. Note: See Chapter 1 for more on
¤ Click Chart ➪ Source ‹ Click the Data Range tab. selecting a range of cells.
Data.
116