
Page 132 - Excel Data Analysis
P. 132
07 537547 Ch06.qxd 3/4/03 12:09 PM Page 118
EXCEL DATA ANALYSIS
CREATE A CHART WITH
MULTIPLE CHART TYPES
ou can create charts that apply different chart types There are some chart types that you cannot combine. For
to each data series. For example, you may want to example, Excel does not allow both a column and bar chart.
Y create a column chart to display one data series and If you attempt to combine non-compatible charts, an error
then include another data series as a continuous line. message displays and the charts are not combined. To verify
Combining chart types allows you to create more complex that you can add a new chart type to the existing chart,
charts. preview the chart selection in the Chart Type dialog box. If
Excel has any problems, messages display in the Preview
To create a chart with multiple chart types, you must first window.
create the main chart type specifying all data values for the
chart. You then select the chart type for the selected data You cannot combine 2D and 3D chart types. In fact, most
series. You can only change the data type for one series at 3D chart types must be the chart type of the entire chart.
a time. Attempts to combine 2D and 3D chart types results in a
warning message: You must either change both chart types
The legend reflects any changes made to the chart type for to 3D or cancel your work. Although you have the option of
a data series. For example, if a data series changes from a creating a different chart type for each data series on the
bar chart to a line chart, a colored line displays as the key chart, avoid using more than two different chart types,
for the data series on the legend. because too many chart types can make your chart
confusing and difficult to interpret.
CREATE A CHART WITH MULTIPLE CHART TYPES
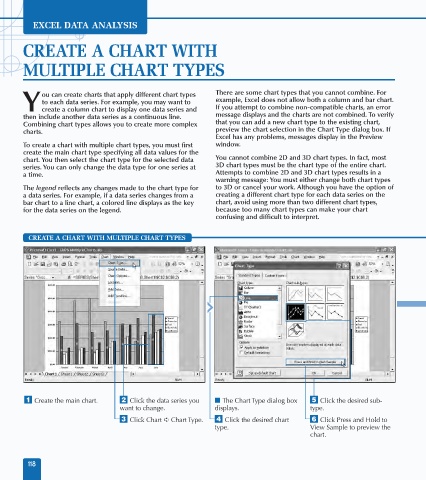
Line
⁄ Create the main chart. ¤ Click the data series you ■ The Chart Type dialog box ˇ Click the desired sub-
want to change. displays. type.
‹ Click Chart ➪ Chart Type. › Click the desired chart Á Click Press and Hold to
type. View Sample to preview the
chart.
118