Page 131 - Excel Data Analysis
P. 131

07 537547 Ch06.qxd  3/4/03  12:09 PM  Page 117


                                                                                           CHARTING DATA 6


                                                 The Data Range tab in the Source Data dialog box allows you
                                                 to only specify a range of contiguous cells for your chart. If you
                                                 want to add data values from another location, you use the
                                                 Add Data option. With this option, you can add data values
                                                 from another worksheet, or even another open workbook.
                                                 However, if you add data values from another workbook, you
                                                 must make sure that workbook remains in the same location
                                                 so that Excel can locate the linked data in the future.
                                                 To add data from another worksheet location, select the chart
                                                 and click Chart ➪ Add Data to display the Add Data dialog
                                                 box. Specify the range for the new data values in the Range
                                                 field. See Chapter 1 to specify a data range.
                                                 When you click OK, the Paste Special dialog box displays. In
                                                 this dialog box, you indicate how to add the new data to the
                                                 chart. If you select the New series option, Excel creates a new
                                                 data series. If you select the New points option, Excel adds the
                                                 new data values to the existing data series. You must specify
                                                 whether the data series are located in rows or columns within
                                                 the newly selected data.


                            Landscape


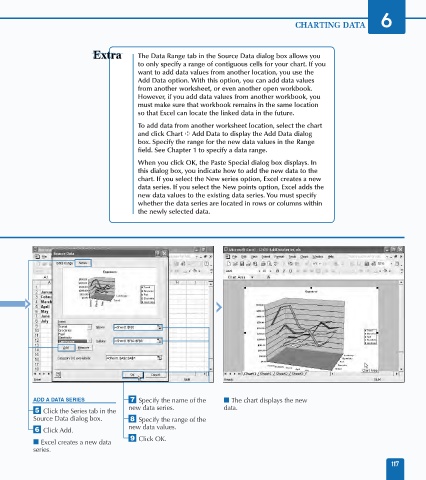
                     ADD A DATA SERIES        ‡ Specify the name of the   ■ The chart displays the new
                                              new data series.          data.
                     ˇ Click the Series tab in the
                     Source Data dialog box.  ° Specify the range of the
                                              new data values.
                     Á Click Add.
                                              · Click OK.
                     ■ Excel creates a new data
                     series.
                                                                                                                     117
   126   127   128   129   130   131   132   133   134   135   136