
Page 127 - Excel Data Analysis
P. 127
07 537547 Ch06.qxd 3/4/03 12:09 PM Page 113
CHARTING DATA 6
When you select a range of cells in a worksheet You can change the formatting for any of the chart
and press F11, Excel creates a chart using the elements. Depending upon the element selected,
default chart format. To determine what the there are different formatting options available in
default chart type is, click Chart ➪ Chart Type ➪ the Format dialog box. To change the formatting,
Custom Types. In the Custom Types tab, click the select the desired chart element and click Format ➪
User-defined option ( changes to ). Click the Selected Element, where Element becomes the
Default option in the Chart Type list to view a name of the selected chart element. There are
sample of the custom chart type. Excel's default different tabs that display for formatting the
chart type is a standard bar chart. appearance of the selected chart element.
You can change the default chart type to any of
the chart types listed on either the Standard
Types or Custom Types tabs. To change the
default chart type, select the desired chart type
and click the Set as default chart option. Keep in
mind that if you select one of the chart types on
the Standard Types tab, you need to also specify
the sub-type.
Custom 3-D Column
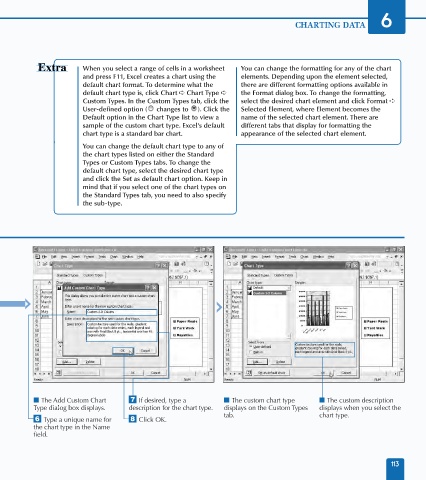
■ The Add Custom Chart ‡ If desired, type a ■ The custom chart type ■ The custom description
Type dialog box displays. description for the chart type. displays on the Custom Types displays when you select the
tab. chart type.
Á Type a unique name for ° Click OK.
the chart type in the Name
field.
113