
Page 128 - Excel Data Analysis
P. 128
07 537547 Ch06.qxd 3/4/03 12:09 PM Page 114
EXCEL DATA ANALYSIS
ADD A TRENDLINE TO A CHART
o illustrate trends that occur in your data, you can To forecast either future or past data values, you use the
apply a trendline to your chart. Trendlines are helpful Forecast options. When Excel adds the trendline, it extends
T in analyzing data because they forecast future data the line to match the number of future or past periods you
values based upon your current data. For example, if you specify. The forecast is based solely upon the values in the
have net sales data for a particular sales team for an entire selected data series and the trendline type.
year, you can predict how the team may perform in the Although you can add trendlines to each data series in the
upcoming year.
chart, Excel only allows you to add trendlines to certain
Forecasts are only accurate if you select the appropriate types of charts. You can add trendlines to bar, column,
trendline. To do so, observe the shape of your charted data, unstacked 2D area, line, stock, xy (scatter), and bubble
and then select a trendline type that best fits the general charts. Trendlines do not work with 3D charts. If you change
trend you see in the Add Trendline dialog box. You can a chart containing trendlines to a chart type that does not
confirm that you have selected the correct trendline by support them, Excel removes them. If the chart type does
looking at the R-squared value. The R-squared value, which not support trendlines, Excel grays out the option on the
ranges from 0 to 1, identifies how closely the values on the menu. For more about the various chart types available in
trendline match the actual values in the data series. The Excel, see the section "Chart Basics."
closer the R-squared value is to 1, the more reliable your
trendline.
ADD A TRENDLINE TO A CHART
2
Travel
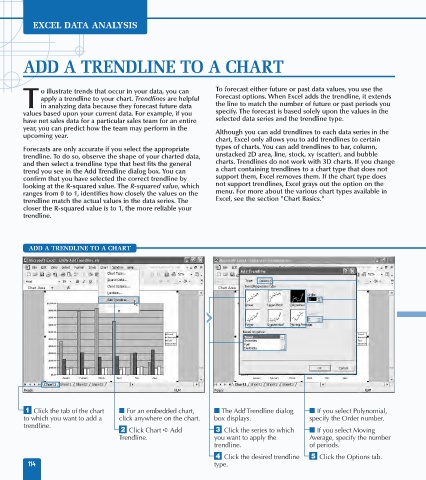
⁄ Click the tab of the chart ■ For an embedded chart, ■ The Add Trendline dialog ■ If you select Polynomial,
to which you want to add a click anywhere on the chart. box displays. specify the Order number.
trendline.
¤ Click Chart ➪ Add ‹ Click the series to which ■ If you select Moving
Trendline. you want to apply the Average, specify the number
trendline. of periods.
› Click the desired trendline ˇ Click the Options tab.
114 type.