
Page 126 - Excel Data Analysis
P. 126
07 537547 Ch06.qxd 3/4/03 12:09 PM Page 112
EXCEL DATA ANALYSIS
CREATE A CUSTOM CHART TYPE
hen creating charts to show analyzed data, you charts available in Excel, see the section "Chart Basics." You
save time and effort by designing a custom chart can create a chart using the Chart Wizard, and then format
W that you can reuse. To use the same chart in it to meet your specifications. You can also adjust the
multiple workbooks, or in multiple projects, you can create scaling of the axes, add gridlines, and specify whether the
a custom chart type, or user-defined chart type, which is chart includes a legend or data table. All formatting and
simply a template for a chart layout. When you create the layout changes become part of the chart type template.
custom chart type, Excel stores all information about the When you save a custom chart type, you must give it a
appearance of the chart, including the chart type, color unique name. You can also create a description of the chart.
changes, fonts, legends, and even data tables. After you Any description you specify displays in the box under the
create a custom chart type, you can save it and select it from sample chart window.
the Custom Types tab in any workbook. The Custom Types
tab maintains a list of both built-in custom chart types that You can eliminate any unwanted user-defined chart types
come with Excel and any user-defined chart types. from the Custom Types by deleting them. You can only
delete the User-Defined chart types; you cannot remove
To create a custom chart type, you must first select the any of the Built-in chart types.
default chart type. For more about the various types of
CREATE A CUSTOM CHART TYPE
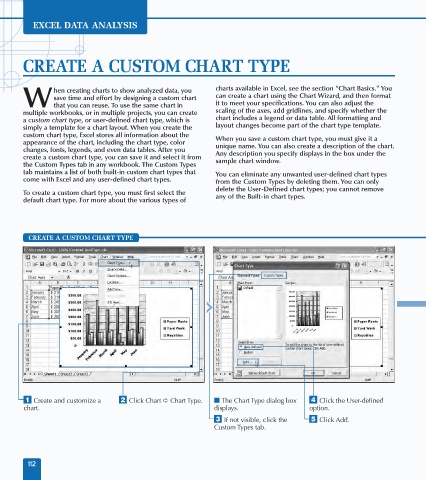
⁄ Create and customize a ¤ Click Chart ➪ Chart Type. ■ The Chart Type dialog box › Click the User-defined
chart. displays. option.
‹ If not visible, click the ˇ Click Add.
Custom Types tab.
112