
Page 296 - Failure Analysis Case Studies II
P. 296
28 1
Table 2. Chemical analysis (wt%) of the failed sight port flange
Component C S Cr Ni Mn Mo Fe
Flange 0.34 0.01 18.9 11.4 1.30 0.50 Balance
Pipe 0.02 0.01 18.5 9.5 1 .so 0.40 Balance
to 70% HNO, (average) at temperatures between 10 and 35 "C. The chemical compositions (Table
2) show high carbon (0.34%) in the flange, but conformity with AISI 304L in the pipe.
Figure 5 shows a stereomicrograph of the cracked region of the component. Figure 6(a) and (b)
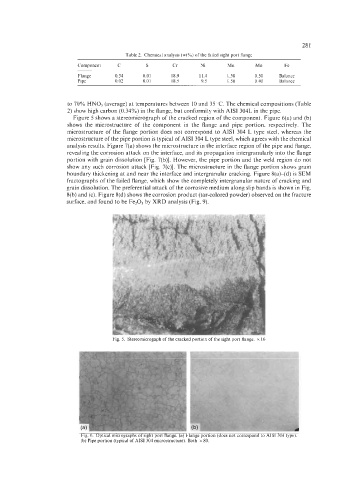
shows the microstructure of the component in the flange and pipe portion, respectively. The
microstructure of the flange portion does not correspond to AISI 304 L type steel, whereas the
microstructure of the pipe portion is typical of AISI 304 L type steel, which agrees with the chemical
analysis results. Figure 7(a) shows the microstructure in the interface region of the pipe and flange,
revealing the corrosion attack on the interface, and its propagation intergranularly into the flange
portion with grain dissolution [Fig. 7(b)]. However, the pipe portion and the weld region do not
show any such corrosion attack [Fig. 7(c)]. The microstructure in the flange portion shows grain
boundary thickening at and near the interface and intergranular cracking. Figure 8(a)-(d) is SEM
fractographs of the failed flange, which show the completely intergranular nature of cracking and
grain dissolution. The preferential attack of the corrosive medium along slip bands is shown in Fig.
8(b) and (c). Figure 8(d) shows the corrosion product (tar-colored powder) observed on the fracture
surface, and found to be Fe203 by XRD analysis (Fig. 9).
Fig. 5. Stereomicrogaph of the cracked portion of the sight port flange. x 16
1
Fig. 6. Optical micrographs of sight port flange. (a) Flange portion (does not correspond to AISI 304 type).
(b) Pipe portion (typical of AISI 304 microstructure). Both x 80.