
Page 87 - Fluid Mechanics and Thermodynamics of Turbomachinery
P. 87
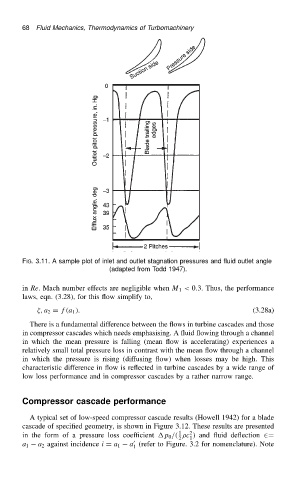
68 Fluid Mechanics, Thermodynamics of Turbomachinery
FIG. 3.11. A sample plot of inlet and outlet stagnation pressures and fluid outlet angle
(adapted from Todd 1947).
in Re. Mach number effects are negligible when M 1 < 0.3. Thus, the performance
laws, eqn. (3.28), for this flow simplify to,
, a 2 D f.a 1 /. (3.28a)
There is a fundamental difference between the flows in turbine cascades and those
in compressor cascades which needs emphasising. A fluid flowing through a channel
in which the mean pressure is falling (mean flow is accelerating) experiences a
relatively small total pressure loss in contrast with the mean flow through a channel
in which the pressure is rising (diffusing flow) when losses may be high. This
characteristic difference in flow is reflected in turbine cascades by a wide range of
low loss performance and in compressor cascades by a rather narrow range.
Compressor cascade performance
A typical set of low-speed compressor cascade results (Howell 1942) for a blade
cascade of specified geometry, is shown in Figure 3.12. These results are presented
2
1
in the form of a pressure loss coefficient p 0 /. c / and fluid deflection 2D
1
2
0
a (refer to Figure. 3.2 for nomenclature). Note
a 1 a 2 against incidence i D a 1
1