
Page 396 - Fluid-Structure Interactions Slender Structure and Axial Flow (Volume 1)
P. 396
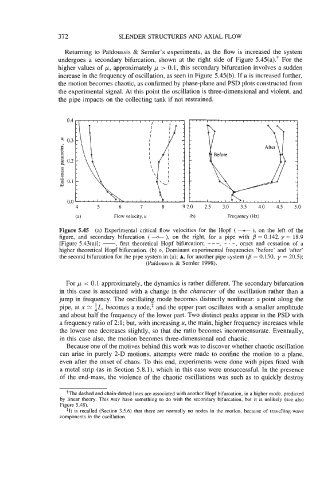
372                SLENDER STRUCTURES AND AXIAL FLOW

                    Returning  to Paydoussis & Semler’s experiments,  as the  flow  is increased  the  system
                  undergoes  a  secondary  bifurcation,  shown  at  the  right  side of  Figure 5.45(a).+ For  the
                  higher values of p, approximately p > 0.1, this secondary bifurcation involves a sudden
                  increase in the frequency of oscillation, as seen in Figure 5.45(b). If u is increased further,
                  the motion becomes chaotic, as confirmed by phase-plane and PSD plots constructed from
                   the experimental signal. At this point the oscillation is three-dimensional and violent, and
                   the pipe impacts on the collecting tank if  not restrained.


                        4     5      6     I      8     9 2.0   2.5   3.0   3.5   4.0   4.5   5.0
                        (a)        Flow velocity, u       (b)         Frequency (Hz)
                   Figure 5.45  (a) Experimental critical flow  velocities  for  the  Hopf  ( -*-   ), on  the  left  of  the
                   figure,  and  secondary bifurcation  ( - on  the  right,  for  a  pipe  with   = 0.142, y  = 18.9
                                                   ),
                                    ,
                   [Figure 5.43(a)]; - first  theoretical  Hopf  bifurcation; - - -,  - . -, onset  and  cessation  of  a
                   higher theoretical Hopf  bifurcation. (b) 0, Dominant experimental frequencies  ‘before’ and  ‘after’
                   the second bifurcation for the pipe system in (a); A, for another pipe system (B = 0.150, y  = 20.5);
                                             (PaTdoussis & Semler 1998).

                     For p < 0.1 approximately, the dynamics is rather different. The secondary bifurcation
                   in  this case is associated  with a change in the character  of  the oscillation rather  than a
                  jump in frequency. The oscillating mode becomes distinctly nonlinear: a point along the
                   pipe, at x 2: iL, becomes a node,$ and the upper part oscillates with a smaller amplitude
                   and about half the frequency of the lower part. Two distinct peaks appear in the PSD with
                   a frequency ratio of 2: 1; but, with increasing u, the main, higher frequency increases while
                   the lower one decreases slightly, so that the ratio becomes incommensurate. Eventually,
                   in this case also, the motion becomes three-dimensional  and chaotic.
                     Because one of the motives behind this work was to discover whether chaotic oscillation
                   can arise in purely 2-D motions, attempts  were  made to confine the motion to a plane,
                   even after the onset of chaos. To  this end, experiments were done with pipes fitted with
                   a metal strip (as in Section 5.8.1),  which in this case were unsuccessful. In the presence
                   of  the end-mass,  the violence of  the chaotic oscillations was  such as to quickly destroy


                     +The dashed and chain-dotted lines are associated with another Hopf bifurcation, in a higher mode, predicted
                   by  linear theory. This may  have  something to do with the secondary bifurcation, but  it is unlikely (see also
                   Figure 5.48).
                     *It is recalled (Section 3.5.6) that there are normally no  nodes in  the  motion, because of  travelling-wave
                   components in the oscillation.