
Page 141 - Subyek Teknik Mesin - Forsthoffers Best Practice Handbook for Rotating Machinery by William E Forsthoffer
P. 141
Compressor Best Practices Be st Practice 3.3
Fig 3.3.8 Rotor response modeling e
rotor (Courtesy of Elliott Co.)
avoided. Also plotted are the horizontal (x) and vertical (y) program. Figure 3.3.9 is an example of a modeled rotor and
bearing stiffness for each bearing. Note that these values vary only includes the rotor stiffness (K) and mass (M).
with speed and are the result of changes in the oil stiffness. In order to accurately calculate the rotor critical speeds, the
Therefore, a change in any of the support stiffness components entire rotor system stiffness, masses and damping must be
noted above can change the rotor critical speed. Experience has considered. Table 3.3.1 models the oil film stiffness and
shown that critical speed values seldom change from 5% of damping of the journal bearings at different shaft speeds.
their original installed values. Note that it is essential that viscosity characteristics of the
If a turbo-compressor with oil seals experiences a signifi- type of oil to be used in the field must be known. End users
cant change in critical speeds, it is usually an indication of should consult with the OEM before changing the oil type as this
seal lock-up. That is, the seal does not have the required will affect the rotor response. In addition to modeling the rotor
degrees of freedom and supports the shaft acting like a bear- and bearings, most rotor response calculations also include the
ing. Since the seal span is less than the bearing span, the rotor following additional inputs:
stiffness ‘K’ increases and the critical speeds will increase in
this case. - Bearing support stiffness
- Oil film seal damping effects
Of all the input parameters, the effects of bearing and seal oil
The rotor system (input) film parameters are the most difficult to calculate and measure.
Therefore, a correlation difference will always exist between the
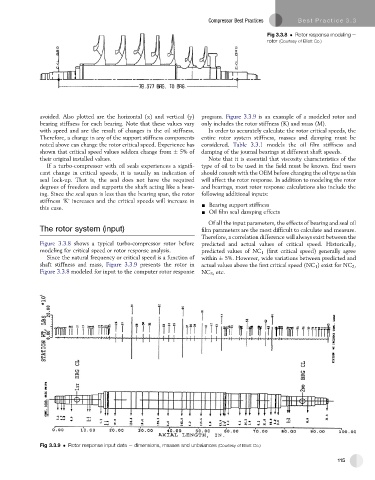
Figure 3.3.8 shows a typical turbo-compressor rotor before predicted and actual values of critical speed. Historically,
modeling for critical speed or rotor response analysis. predicted values of NC 1 (first critical speed) generally agree
Since the natural frequency or critical speed is a function of within 5%. However, wide variations between predicted and
shaft stiffness and mass, Figure 3.3.9 presents the rotor in actual values above the first critical speed (NC 1 ) exist for NC 2 ,
Figure 3.3.8 modeled for input to the computer rotor response NC 3 , etc.
Fig 3.3.9 Rotor response input data e dimensions, masses and unbalances (Courtesy of Elliott Co.)
115